
You trust 2D electrophoresis for its ability to separate complex protein mixtures. In theory, it gives you a powerful map—first dimension by isoelectric point (pI), second by molecular weight. Two axes. Thousands of protein spots. A snapshot of cellular protein expression.
But here’s what no one tells you loud enough: your beautiful 2D gel can betray you.
The truth is, even with experience and careful handling, 2D gels can mislead. Misidentifications, missing proteins, artifacts—you’re dealing with a method as fragile as it is informative. It’s not just about technique, it’s about understanding where the workflow can derail and what it takes to stay on track.
Let’s walk through where your protein mapping can go wrong—and what you can do to catch errors before they compromise your study, your publication, or your product.
The Illusion of Separation
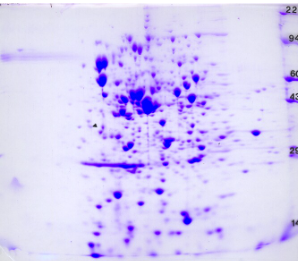
You run a perfect 2D protein gel, spot-laden and evenly spread. It looks like success. But visual success isn’t scientific success.
2D electrophoresis assumes:
- Clean sample prep
- Complete solubilization
- No streaking or aggregation
- Uniform migration
- Proper focusing
Those assumptions collapse fast in complex samples—especially when working with membrane proteins, high-molecular-weight proteins, or PTM-heavy targets.
Here’s the kicker: if you only look for what you expect to find, you’ll miss the real story hidden in the data.
Sample Prep: Where Trouble Starts
Most protein analysis services rely on buffers that solubilize proteins without breaking them. But 2D gels demand more. You need harsh detergents and chaotropes like urea, thiourea, CHAPS, and DTT to break open stubborn aggregates and unfold proteins for proper migration.
If you skip optimization here, you’ll:
- Miss insoluble proteins entirely
- Watch proteins streak or clump on the gel
- Lose resolution between isoforms
Worse, sample contaminants like salts, DNA, or lipids will disrupt isoelectric focusing (IEF) and create horizontal smears across the gel.
Clean input = clean output. Contaminated input = chaos.
The pH Gradient Doesn’t Always Play Fair
The first dimension of 2D electrophoresis—isoelectric focusing—relies on the formation of a stable pH gradient in an immobilized strip.
In reality, gradients can drift.
You may see:
- pH extremes collapsing
- Acidic proteins streaking
- Basic proteins not focusing at all
This results in protein “disappearance” from one end of your map. They didn’t vanish—they just didn’t focus correctly.
This can throw off HCP analysis, especially when characterizing charge variants or PTMs. One bad strip = one compromised lane of data.
The Second Dimension Isn’t Immune
You’ve focused your sample. Now you run SDS PAGE electrophoresis in the second dimension to separate by molecular weight.
But protein behavior here is equally volatile.
Glycosylation? It shifts migration. Phosphorylation? Alters charge and shape. Partial degradation? Adds confusing bands.
So what you think is a clean 30 kDa protein may actually be three different forms stacked together. Unless you excise and identify by MS, you’re operating on assumptions, not facts.
Even common Western blotting protein confirmation steps can’t fully resolve this if the antibody sees multiple isoforms.
Artifacts Are Inevitable—Unless You Catch Them
Artifacts are everywhere in 2D gels:
- Salt “ghost” spots
- Keratin contamination
- Overloaded streaks
- Oxidation-induced smears
These spots are distractions at best, and false signals at worst. You might circle an intense “protein of interest” only to realize it’s human skin contamination or a polymer artifact from your IPG strip.
To catch them:
- Run technical replicates
- Include blank control lanes
- Stain with multiple dyes (e.g., silver and Coomassie)
- Cross-check with a second method
Remember: protein concentration SDS PAGE is fine for confirmation, but it won’t replicate the same charge-to-mass separations 2D gels reveal.
Identification Isn’t As Certain As You Think
You spot a dramatic change between two samples. Excise the gel. Submit for MS. The results give you 4–5 candidate proteins. So you pick the one that makes the most sense and publish.
Hold up.
2D gel electrophoresis routinely delivers mixed spots. Co-migration is common. A 1 mm² spot can contain multiple proteins, especially in dense areas of the gel.
And the one you pick? May not be the one driving the biological effect.
The real identification process should involve:
- High-res MS/MS
- Peptide coverage thresholds
- Database confirmation
- (Ideally) Western blot validation
That’s why protein analysis lab workflows always validate with orthogonal methods.
Dynamic Range is a Liar
Most 2D gels can visualize 100–500 spots per gel, depending on stain sensitivity. But your proteome contains thousands of proteins.
So what are you missing?
- Low-abundance signaling molecules
- Small peptides (<10 kDa)
- Hydrophobic or basic proteins
These drop below the detection threshold or fail to migrate correctly. That leads to blind spots in your analysis, especially dangerous when screening for HCP antibody coverage.
You may think your host cell proteins are under control when they’re simply invisible.
To expose the full picture, you’ll need enrichment strategies or alternative techniques like LC-MS/MS.
You’re Not Quantifying What You Think You Are
Spot intensity feels like it should reflect protein abundance. But staining efficiency varies by amino acid composition, structure, and folding.
Silver stain is notoriously nonlinear. Fluorescent stains improve consistency, but even they have quirks.
If you’re running 2D gels for differential expression studies, you’d better use image analysis software with built-in normalization, reference spot correction, and intensity thresholds.
Otherwise, your “twofold increase” may be a dye-loading difference, not a real expression change.
Post-Translational Modifications Muddle Everything
Proteins with PTMs—phosphorylation, acetylation, ubiquitination—migrate differently in both dimensions.
You’ll see spot trains or horizontal drifts that mimic expression changes.
But they’re not changes in quantity—they’re biochemical tweaks to the same protein.
If you’re probing Western blot phosphorylated proteins, 2D gels are a fantastic tool—if and only if you combine them with modification-specific antibodies or phospho-enrichment steps.
Otherwise, you’re guessing what the extra spot means.
Milk Proteins: A Case Study in Confusion
If you’ve worked with dairy, you know that milk protein analysis can be a mess in 2D gels.
Caseins migrate unpredictably due to heavy phosphorylation. Whey proteins overlap. Isoforms and processing fragments blur clean identifications.
Add in contamination from your milk testing laboratory, and it becomes nearly impossible to assign unique identities to spots without tandem MS.
So if your client wants to correlate milk testing lab data with 2D gel maps, prepare to explain the limitations—and offer alternatives.
Don’t Let the Map Fool You
Think of a 2D electrophoresis gel like a subway map. It shows you connections, locations, clusters. But it’s a stylized representation—not the real terrain.
If you follow it without cross-referencing with tools like:
- Mass spectrometry
- ELISA
- Western blot gel electrophoresis
- Label-free quantitation
…then you’re relying on symbols, not reality.
In drug development, diagnostics, or HCP analysis, those misinterpretations can carry massive consequences.
Want to see case examples of how 2D misreads have shaped downstream decisions? Just look at this web-site to explore regulatory outcomes and validation data.
When to Use 2D Electrophoresis—And When Not To
Use It When:
- You need to separate isoforms or PTMs
- You want a visual comparison of sample complexity
- You’re performing exploratory biomarker discovery
- You’re mapping HCP antibody reactivity zones
Avoid It When:
- You need deep proteomic coverage
- Your sample is highly hydrophobic
- Time-to-result is critical
- You can’t control for staining and prep variability
For robust workflows, pair 2D with quantitative LC-MS or data-independent acquisition (DIA) tools. Think of 2D as a visual fingerprint—not a quantitative assay.
You can learn more here about hybrid workflows that leverage both image-based and digital proteomics effectively.
Final Takeaway
2D electrophoresis isn’t obsolete—but it isn’t infallible, either.
As someone who relies on protein data—whether for academic research, pharmaceutical QA, or protein analysis lab services—you need to see the full story. Not just a pI vs. kDa scatterplot, but the biological context, chemical modifications, and technical artifacts that shape what you think you’re seeing.
Question every spot. Validate every assumption. Understand where your map might be off—and why it matters.
2D gels still have a place in the proteomic toolkit. But only if you respect their strengths and confront their weaknesses.